Riverina: capturing the extents of a localised, patchy rainfall event.
In the temperate climate zones in Australia, the changing climate has moved away from reliable winter rains to more frequent and patchy rainstorm events. Despite heavy rainfall in some areas, farmers in eastern Australia report that the patchy rainfall often failed to break drought conditions. Many areas are not receiving enough rainfall to increase soil moisture at depth, or are receiving water run-off required to fill dams.
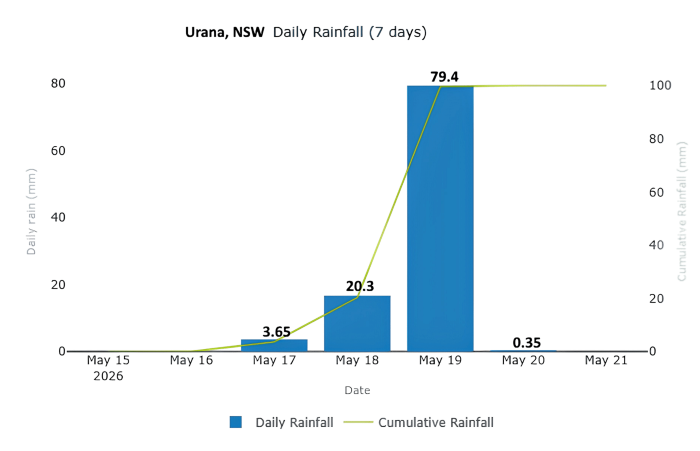
To illustrate the point, This Case Study examines the use of Rainfall Mapper to map the extent of a localised, intense rainfall event that occurred on May 18th and 19th, 2026, around Urana, a small town in the Riverina region of New South Wales, which is located between Lockhart and Jerilderie, about 561 kilometres southwest of Sydney.
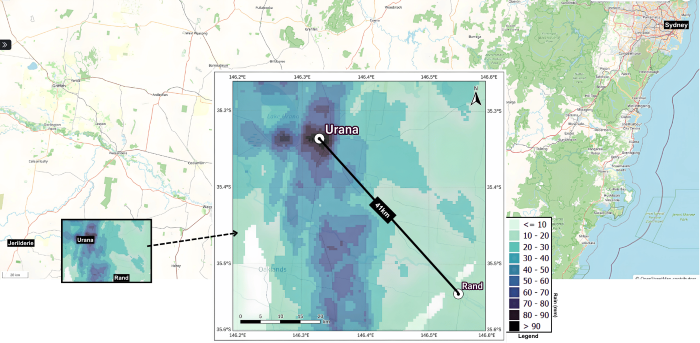
Using Rainfall Mapper, the rainfall for the two-day event can be mapped in the vicinity of Urana, showing up to 100 mm of rain recorded.
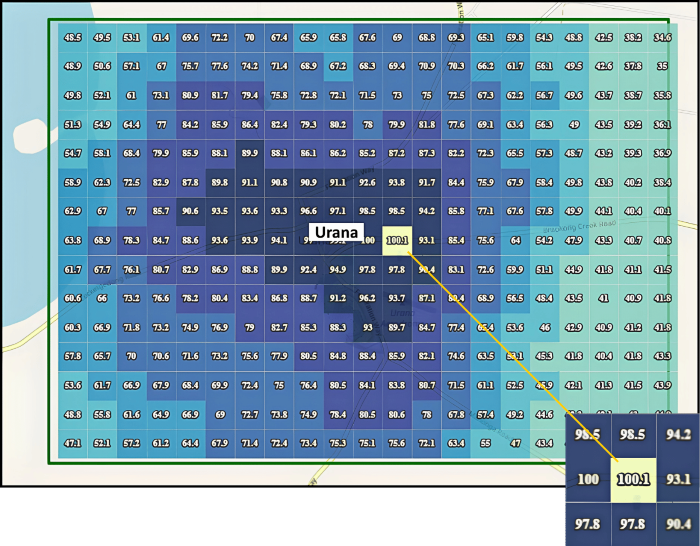
The variability in rainfall was recorded by the Bureau of Meteorology’s (BoM) rain gauges in their network. The BOM's many rain gauges are tens of kilometres apart, as shown in the following figure.
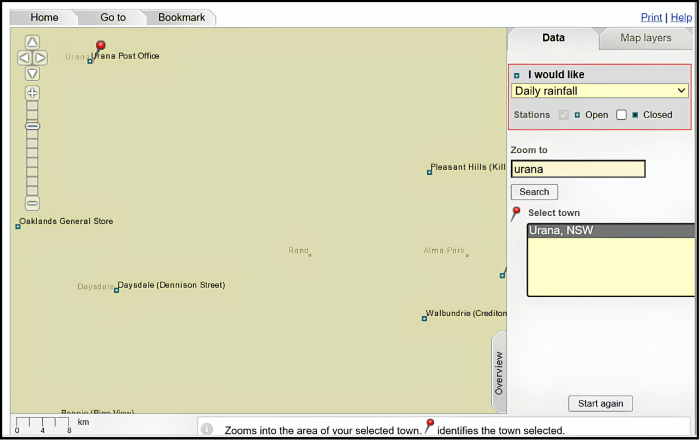
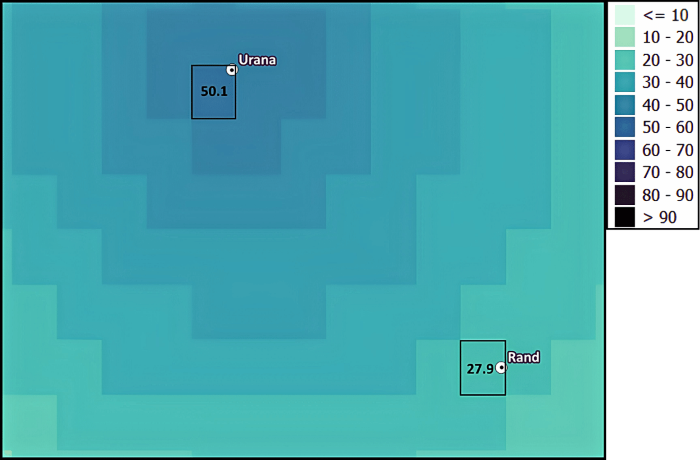
Similarly, the daily rainfall amounts estimated by the Scientific Information for Land Owners (SILO) model do not show the localised intensity of the rainfall.
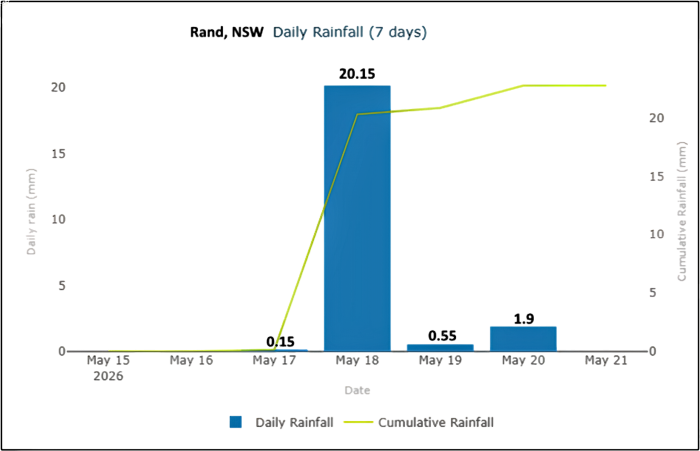
A story in The Weekly Times (May 21, 2026; Farmers report patchy rain is not a ‘game changer’ despite heavy falls) included commentary from a Rand district farmer highlighting significant variability in rainfall across his property, with rain gauge recordings between 9mm and 28mm. Neighbouring properties near Urana received up to 40mm, and some areas around Urana received 50mm of rain.
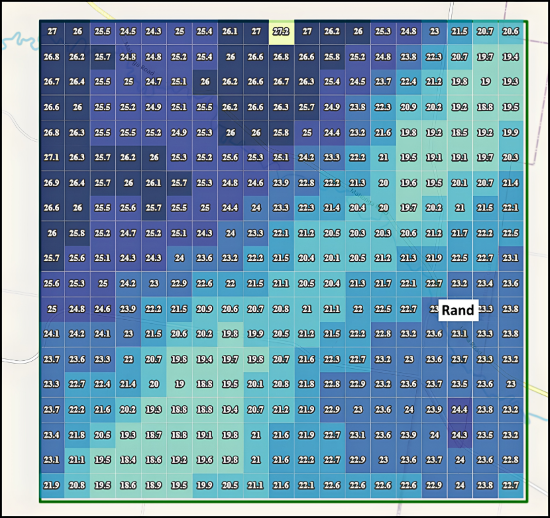
Rainfall Mapper illustrates this gap in coverage around this farmer’s property, as shown in the image below. Rainfall from the event varies from 20mm a little north of Rand to around 100mm just south of Urana, roughly 30 km apart.
For intense and patchy rainfall events, Rainfall Mapper provides more accurate data about how much rain fell where and when. This detailed data is important for property owners as it can assist them with planning and decision-making for seeding crops and pastures, siting dams, and improving their farm practices, such as managing soil erosion.


02 4921 5473
enquiries@soilcrc.com.au
CRC for High Performance Soils
Level 1, IDC Building
University of Newcastle
University Drive
Callaghan NSW 2308
Australia

03 5327 9314
cerdi.admin@federation.edu.au
Suite 15, Greenhill Enterprise Centre
Ballarat Technology Park
University Drive, Mount Helen