Victorian Wimmera / Southern Mallee: capturing localised, intense, summer thunderstorms.
Increasingly, a large proportion of rainfall in south-east Australia is linked to thunderstorms. Weather systems, such as troughs, frequently generate erratic, short-lived and isolated bursts of precipitation resulting in intense localised rainfall.
These events are often poorly represented in the official rainfall records from the Bureau of Meteorology (BoM) due to the placement of the BoM’s rain gauges, that limit the capture of data for localised rainfall events. Using two rainfall examples, this case study demonstrates the value of Rainfall Mapper with the finer resolution to more reliably map rainfall at the farm scale.
To demonstrate this, a localised thunderstorm with intense rainfall was measured by the Rainbow weather radar located in the Wimmera / Southern Mallee, Victoria, on the afternoon of the 7th of January 2022.
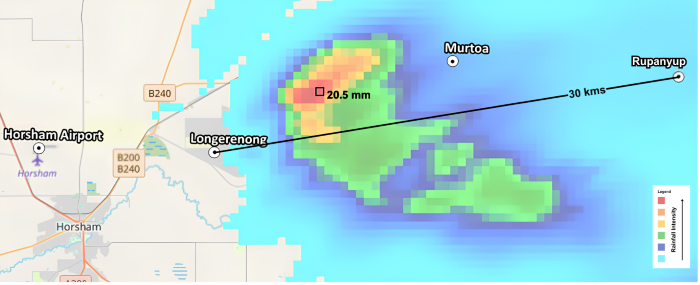
The thunderstorm was located between the towns of Longerenong and Rupanyup, approximately 30 kms apart. The peak rainfall intensity for a 500 m x 500 m tile recorded by the weather radar was 20.45 mm in one 15-minute interval.
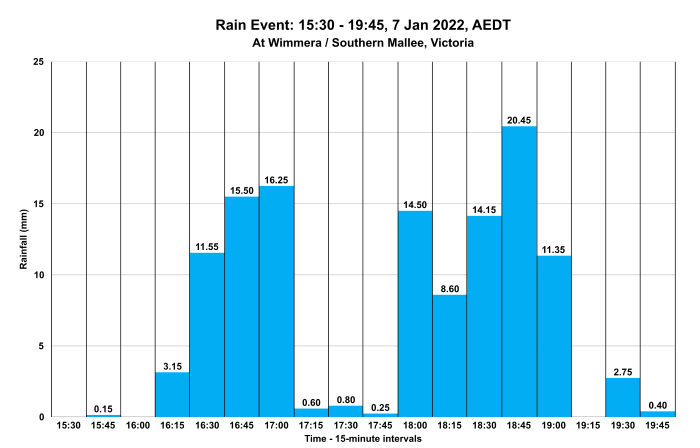
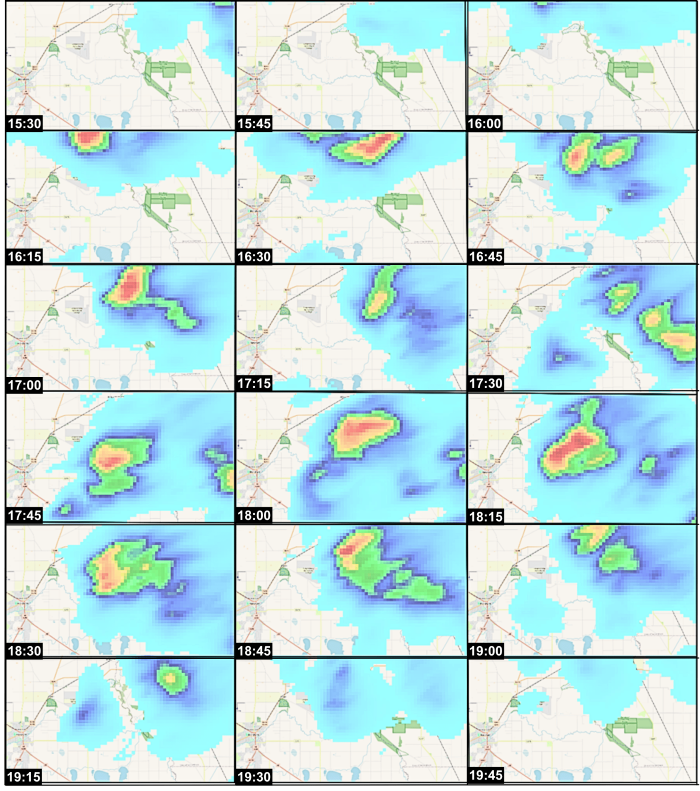
The thunderstorm moved through the region as shown in the time sequence of Rainfield3 precipitation data at 15-minute intervals as measured by the Rainbow weather radar.
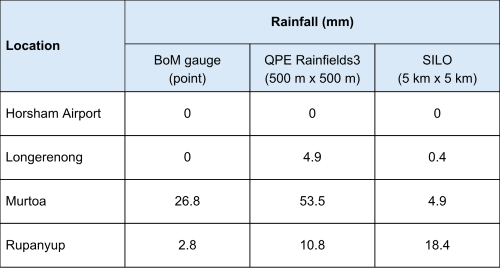
The limited areal distribution of the rainfall meant that the spatial extent of the precipitation in this event was not entirely recorded by the four official BoM rainfall gauges in the region. The record for the daily rainfall collected in the 24 hours prior to 0:900 8th January 2022 AEDT (that is, the day of the storm), is shown in the table below, compared with the radar data and the widely used rainfall map (SILO).
Scientific Information for Land Owners (SILO) - Queensland Government, maps the rainfall in 5 km x 5 km grid tiles, modelled using the daily rainfall amounts recorded at the gauges to 9 am on 8th January 2022.
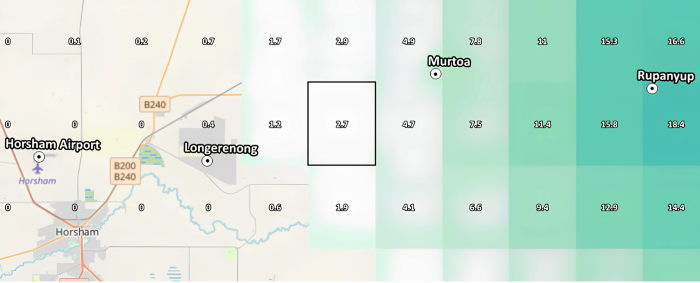
The grid cell (above) and highlighted records daily rainfall of 2.7 mm. SILO is often used to get the input values used in models, such as water balances, rainfall-runoff models, soil water models, pasture growth and crop models.
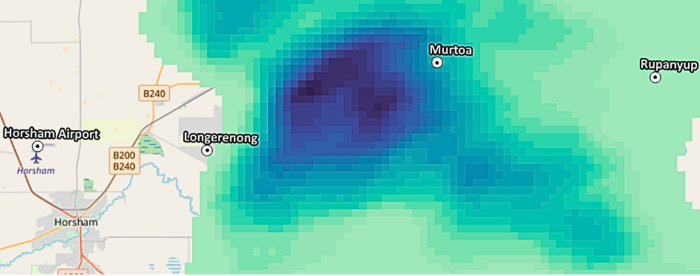
By comparison, Rainfall Mapper provides a much more accurate map of the daily rainfall amounts resulting from the thunderstorm, with 500 m x 500 m tiles of daily rainfall amounts to 9 am on 8th January 2022.
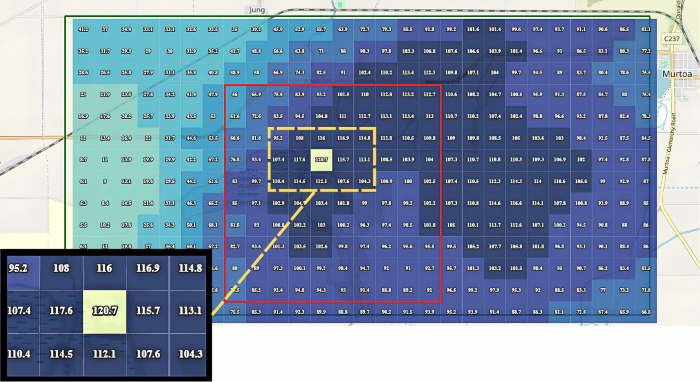
Closer inspection of Rainfall Mapper (above) displays 500 m x 500 m tiles of daily rainfall ranging from 56 to 120.7 mm. The red rectangle depicts the corresponding SILO tile with a daily rainfall value of only 2.7 mm, highlighting the limitation of SILO gridded data to represent daily rainfall values, especially in areas experiencing localised, intense thunderstorm activity.
Significant localised intense thunderstorm activity occurred in the Southern Mallee / Wimmera region of northwestern Victoria between the 28th of February 2026 and the 2nd of March 2026.
This is clearly visible in the following figure from the Rainbow weather radar plots for the 1st and 2nd of March 2026.
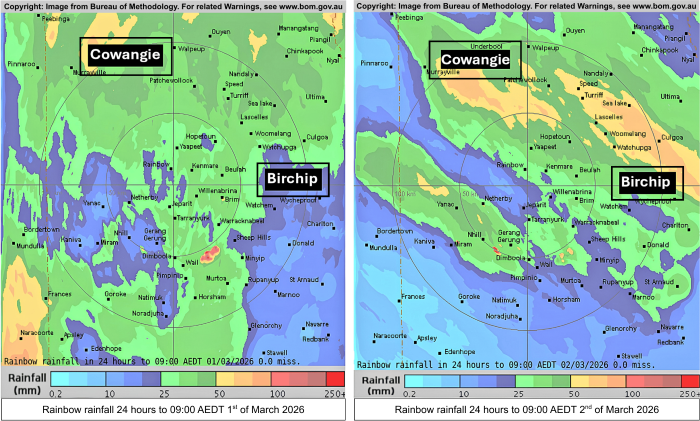
Rainfall Mapper, located in the vicinity of Cowangie, presents the total for the three-day event, with up to 152mm of rain recorded.
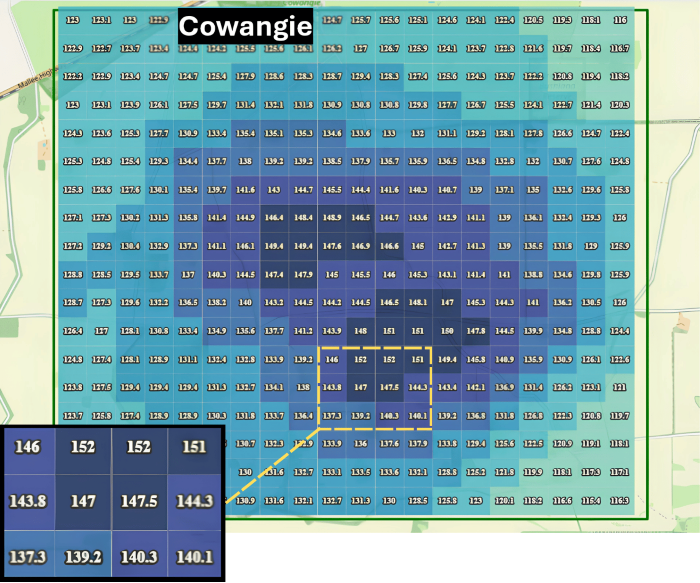
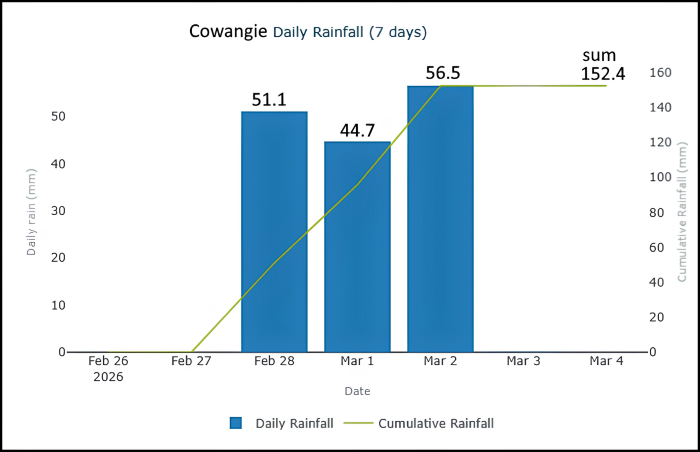
Similarly, details from the Rainfall Mapper of daily rainfall northwest from Birchip, Victoria indicate up to 121mm of rain recorded for the same three days.
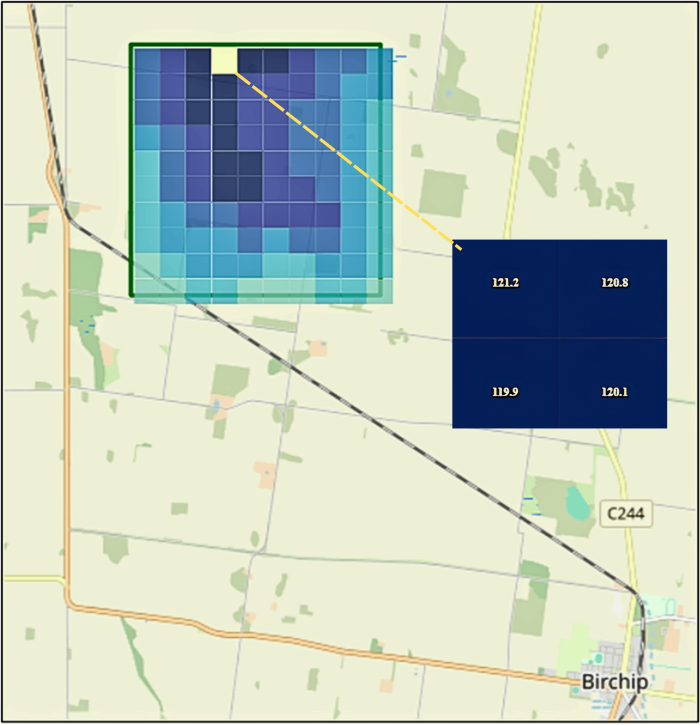
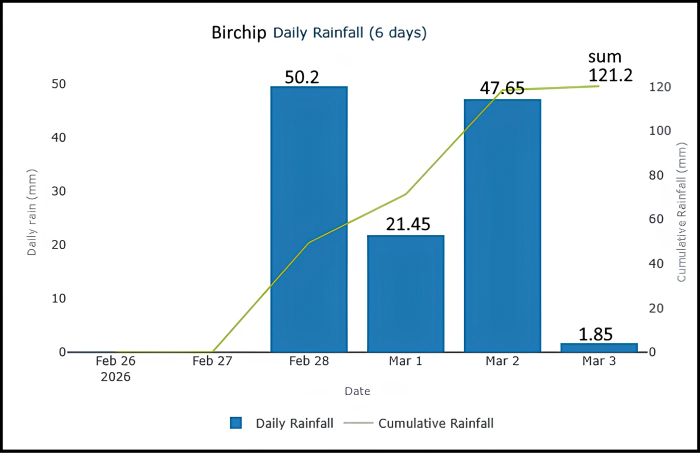
The growing season was set up well with valuable subsoil moisture from the early March rainfall, but subsequent warm days dried the top of the soil profile quickly. Northwest of Birchip, about 120mm of early March rain was enough to kick-start seeding, although the following drying conditions tested the ability of the germinated seed to bridge the gap to the wetter parts of the soil profile. Early autumn rain promised a traditional seeding program, but warm days and little follow-up rain have dried things out.
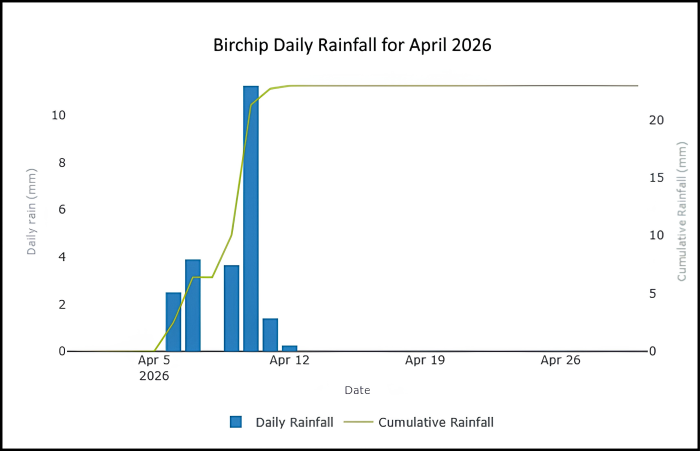
Both these examples demonstrate the ability of Rainfall Mapper to provide more accurate estimations of rainfall at the paddock scale, compared to the BoM rainfall records or the SILO models. Moreover, the radar-rainfall represents rainfall input across an area, rather than being measured at a point, which is useful to understand the variation in where the rain fell, which can be used as a guide to the spatial variation in soil moisture. Being able to see the rainfall history also provides information on how much subsoil moisture there could be in the soil profile at different places across a farm or region.


02 4921 5473
enquiries@soilcrc.com.au
CRC for High Performance Soils
Level 1, IDC Building
University of Newcastle
University Drive
Callaghan NSW 2308
Australia

03 5327 9314
cerdi.admin@federation.edu.au
Suite 15, Greenhill Enterprise Centre
Ballarat Technology Park
University Drive, Mount Helen