Mapping the rainfall patterns in the Wheatbelt region resulting from Tropical Cyclone Mitchell
The Case Study illustrates the use of Rainfall Mapper to demonstrate the widespread variations in rainfall across the Mid West and Wheatbelt regions of Western Australia in early February 2026. The rainfall event commenced on Tuesday, February 9th, 2026, when the remnants of Tropical Cyclone Mitchell linked up with a trough and cold front in the south of WA. The front and trough stripped the moisture from the former cyclone and spread it east and south (as explained by Weatherzone meteorologist Joel Pippard). Significant rainfall occurred in numerous locations up to Thursday, February 11th.
| Geraldton |
|---|
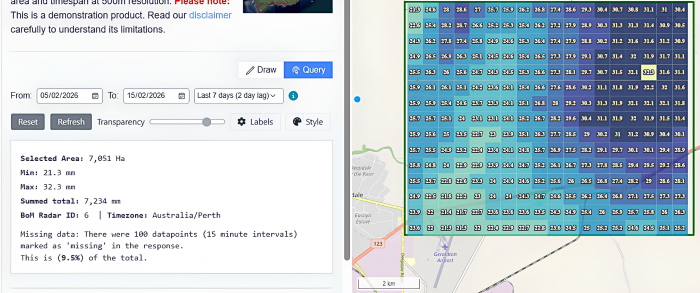
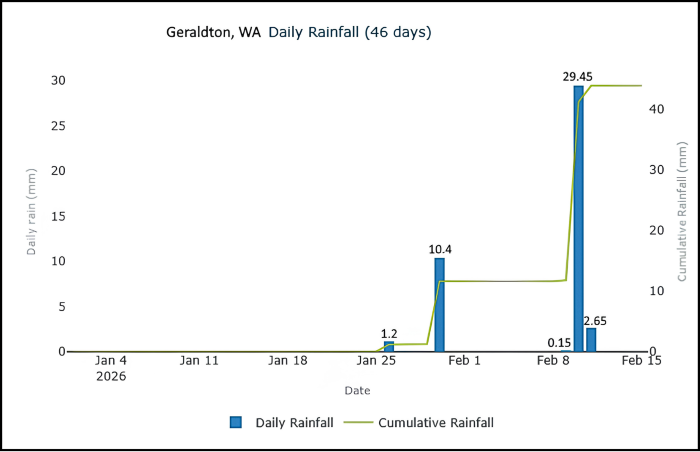
At Geraldton, the coastal city in the Central West, 16.8mm was recorded in the Bureau of Meteorology’s (BoM) weather station at the Airport, which was the heaviest daily rain recorded since September 2nd, 2025. However, Rainfall Mapper shows that double that amount fell 5-10 km northeast from the airport, where Rainfall Mapper records up to 32.3mm of rainfall.
Further west, about 8km north of the town of Morawa, in the Mid West above the Wheatbelt, 106.9mm was recorded, where the January average is just 20.2mm.
The town of Morowa is located between the weather radar coverage of the Geraldton and Watheroo radar stations. And therefore lies in a ‘blind spot’ for Rainfall Mapper.
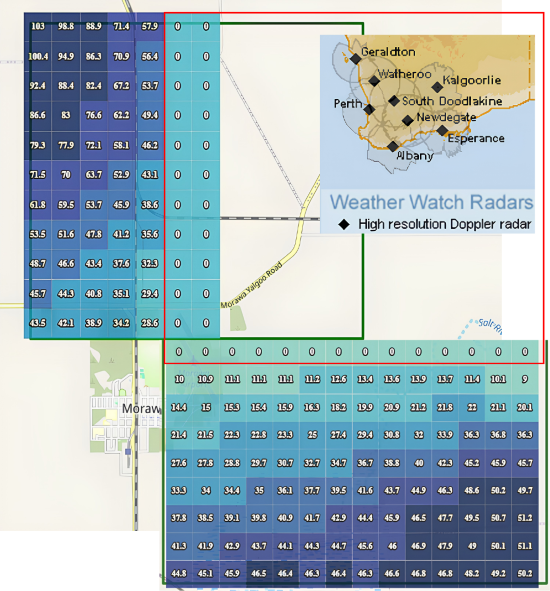
The red rectangle indicates the area not covered by either the Geraldton or the Watheroo radars. It should be noted that Rainfall Mapper does not attempt to mosaic adjacent radars to fill in these gaps.
| Dalwallinu |
|---|
Further south, Dalwallinu in the Central Wheatbelt recorded 48.7mm of rainfall, which was a welcome addition to the meagre 11.2mm of rain that had been recorded for the entire summer before the February event. Dalwallinu is the home of the Liebe Farming Group.
The rainfall distribution over the two-day event was varied, with the maximum total of 61.3mm recorded around 7km south of the town centre.
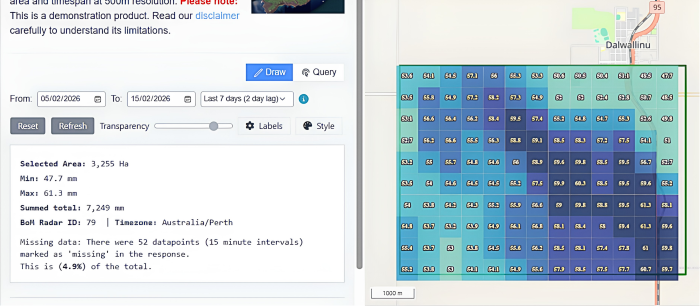
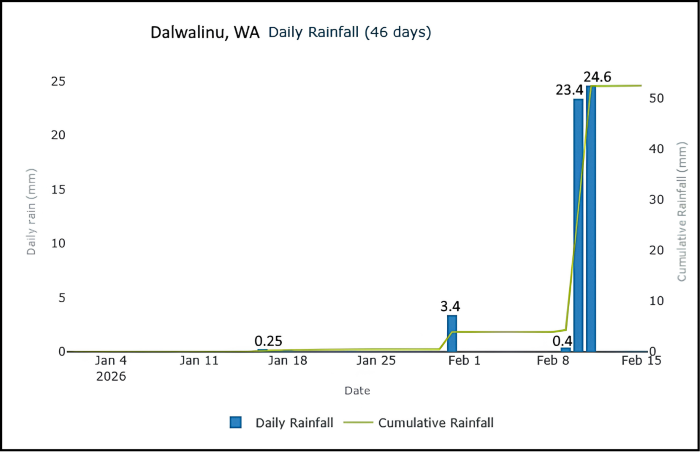
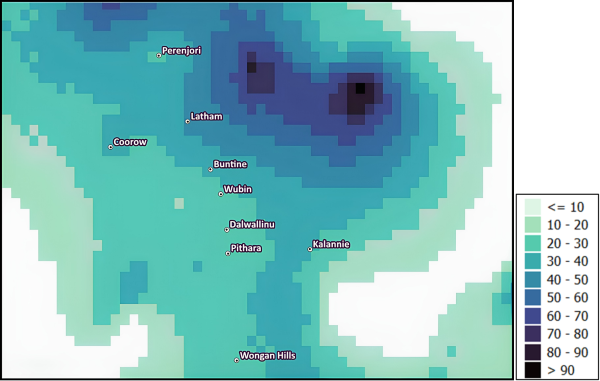
Summer rainfall since January 1st, 2026, was 3.9 mm prior to the February event, which lifted the cumulative total to more than 50mm. The areal distribution of the rain is seen in the broader-scale Scientific Information for Land Owners (SILO) data.
| Newdegate |
|---|
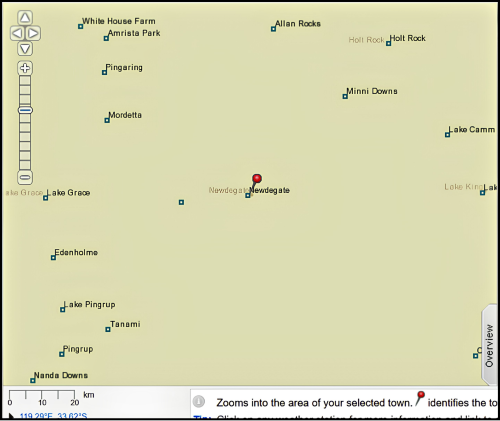
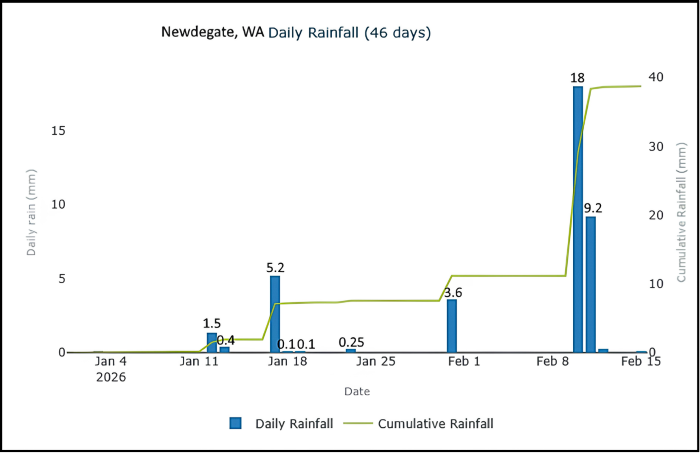
In the southern Wheatbelt, 29.2mm was recorded at the town of Newdegate, where no daily total of more than 1mm had been recorded at the Newdegate Research station (18km west of the town) for the summer up until the February event.
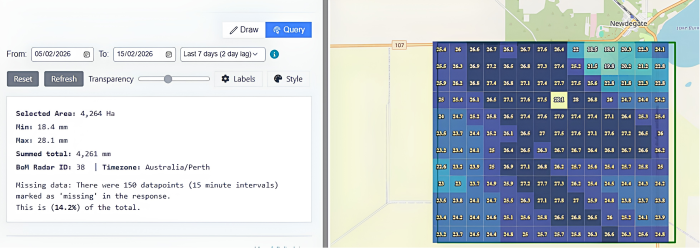
In this region, the official BoM rain gauges are sparsely located, and Rainfall Mapper maps a different summer rainfall profile for nearby locations (within 5 kms), showing the extent of the more localised rainfall than is indicated by the sparsely located BoM rain gauges.
Rainfall Mapper records up to 28.1mm of rainfall approximately 5km southwest of the town, which lifted the cumulative rainfall total for the year to date from around 10mm to 40mm.
The above examples demonstrate how Rainfall Mapper can be used to provide a finer resolution of the areal distribution of total rainfall for a widespread event that resulted in quite variable rainfall. This helps visualise the received moisture at the paddock scale, which in turn provides some useful information for farm management decisions, such as soil moisture, seeding, weed control, rainfall runoff or erosion control.


02 4921 5473
enquiries@soilcrc.com.au
CRC for High Performance Soils
Level 1, IDC Building
University of Newcastle
University Drive
Callaghan NSW 2308
Australia

03 5327 9314
cerdi.admin@federation.edu.au
Suite 15, Greenhill Enterprise Centre
Ballarat Technology Park
University Drive, Mount Helen